Foliage Timing & Seasons
How Fall Foliage Forecasts Actually Work
By Benjamin Janes · Published
· 6 min read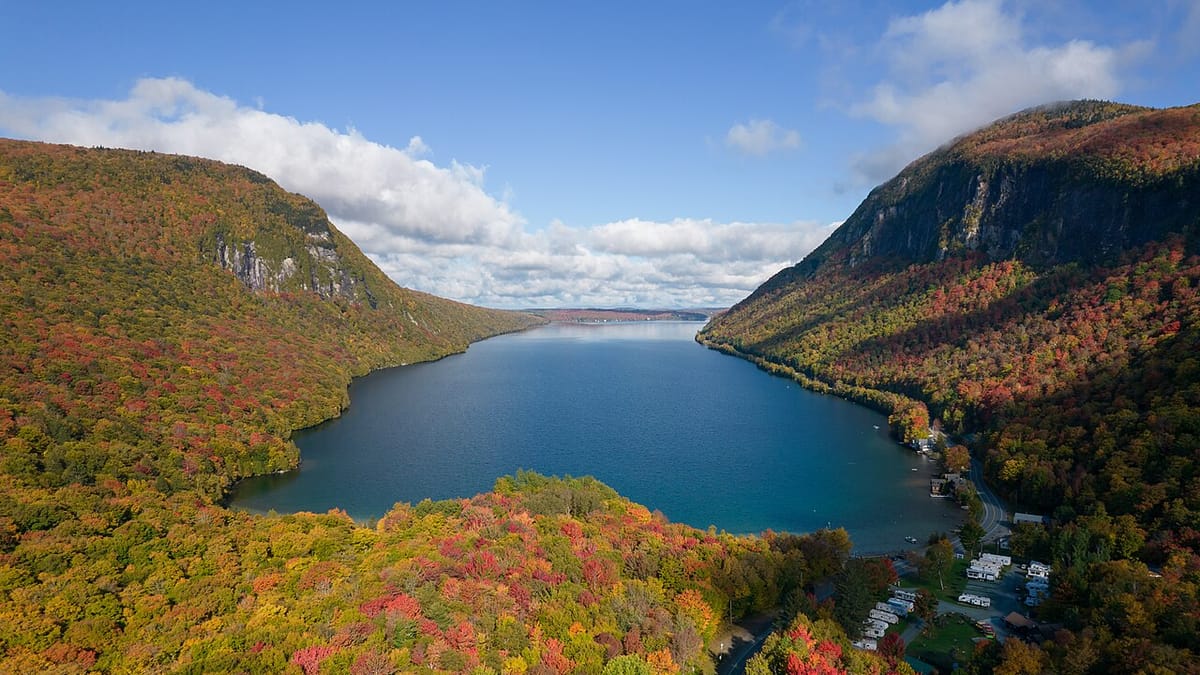
Forecasters start with something fixed: the night length that triggers a tree's shutdown, known years in advance for any latitude. Everything after that, temperature, drought, sun, terrain, is a moving estimate the model has to keep correcting as the season plays out.
The one thing that isn't a guess
Every fall color forecast rests on one dependable fact: trees read night length, and night length for any given latitude is astronomy, not weather. It repeats the same every year, predictable a decade out if you bothered to calculate it. That is why a forecaster can say with real confidence that Vermont will start turning well before a region several hundred miles south, long before anyone knows what the actual temperatures will do that fall. The trigger sets a floor under the forecast: roughly when a region enters its turning window. It does not say how fast the color builds, how vivid it gets, or how long it holds before a storm strips it. That part is where the real forecasting work happens, and it stays uncertain in a way the trigger date never is.
What a forecast actually has to guess at
Once the trigger fires, four things determine what happens next, and none of them are known in advance the way night length is. Temperature decides how fast the visible chemistry runs; a warm stretch after the trigger can stall color for days even though the tree has already started its internal shutdown. Soil moisture and drought stress change the outcome entirely, sometimes pushing a tree to skip a vivid stage and go straight to dull brown. Sunshine feeds the sugar production that drives the reddest pigments, so a cloudy, humid stretch tends to mute a display that would otherwise have been sharp. And terrain, elevation and the direction a slope faces, shifts timing by days or weeks between two points that sit close together on a map. A forecast has to estimate all four before they happen, using the best available weather data for the location, then keep updating that estimate as real conditions arrive.
Accumulating a signal, not counting down a date
The models behind most serious forecasts work less like a calendar and more like a bucket filling with water. Instead of counting down to a fixed day, the model tracks a running total, usually built from daily temperature, and adds to it every day after the seasonal trigger fires. Cold days add more to the total than mild ones. Once the running total crosses a threshold calibrated against how that species and region actually behave, the model marks the spot as turning. This approach, sometimes called a growing degree day or chilling accumulation model, is why forecasts respond to a real cold snap or a real warm spell instead of repeating an average year's date on a loop. It also explains why two years with the same trigger date can still peak a week or two apart, since the accumulation simply ran faster in one of them.
Why a forecast is a moving front, not a date
Because the trigger depends on latitude and the accumulation depends on elevation and local weather, color never arrives everywhere in a region on the same day. It moves the way a weather front moves, sweeping south with the advancing edge of long nights and dropping downhill as cold air pools first at altitude. A single state can have a mountain corridor deep into color while a lowland town an hour away is still holding summer green. That is also why a single peak date for an entire region is a simplification, not a precise fact. The window you see for Colorado is really describing an average across a lot of smaller peaks happening at slightly different times across very different elevations within the same state. October 1–October 18, 2026 (forecast) reflects that average, and a specific trailhead can reasonably run a week or more ahead or behind it depending on how high it sits. That north-south, high-low movement is covered in more depth in why fall color moves south and downhill, worth a look if you're timing a trip around a specific elevation rather than a whole region.
The real sources of uncertainty
Even a well-built forecast can miss, and it helps to know where that risk comes from rather than writing a forecast off as either infallible or unreliable. A heat wave after the trigger fires can stall color development for a week or more, pushing a display later than the early estimate suggested. A summer drought can do the opposite, forcing stressed trees to shut down early and skip straight to a duller, shorter display instead of the vivid stretch a healthy year would have produced. Once color has arrived, a single hard wind and rain event can strip a canopy in a day or two, ending the season regardless of how accurate the buildup forecast was. None of these are forecasting failures exactly. They're the reason a forecast is a probability, sharpened continuously against incoming weather, rather than a fact fixed the day it's published. The weather that makes or ruins a foliage year goes deeper into how each of these specific events tends to play out.
How this site builds its own forecast
The Vermont and Colorado windows on autumnguide.com, and every other region on the map, come from a phenology model run against daily ERA5 reanalysis temperature data, a gridded historical weather record that reconstructs conditions at a given location and day more precisely than a handful of weather stations can. That temperature signal drives the accumulation model described above, region by region and season by season. Terrain comes from roughly 30-meter elevation data, fine enough to tell a ridge from the valley immediately below it, which is how the map can show a mountainside turning well ahead of the town at its base instead of averaging the two into one less useful number. At the end of each season, the model's predictions get checked against real submitted photos from the actual locations, and the calibration gets adjusted for the next year based on where the model ran early, ran late, or got a region right. That feedback loop keeps the forecast grounded in what actually happened on the ground instead of drifting further from reality year after year.
Read the map, not just a headline date
The most useful way to use any of this is to stop looking for a single number and start watching the front move. On the interactive map, scrub the date slider across a few weeks and you can watch color build north to south and high to low in something close to real time, the same pattern described above, rendered spot by spot instead of averaged into one window per region. That view makes the uncertainty visible too: a region still shown as green in early weeks isn't a forecasting gap, it's the model correctly showing that the trigger hasn't fired there yet. Pair that with October 7–October 11, 2026 (forecast) or the equivalent window for wherever you're headed, and you get both pieces a forecast is actually built from: the fixed trigger that sets the rough shape of the season, and the weather-driven estimate layered on top that gets more accurate the closer you get to going.
For the deeper background on what "peak" itself is measuring, separate from how it's forecast, what is peak foliage covers that definition directly and explains why even a perfect forecast still describes a window rather than a single ideal day.
Frequently asked
- How far in advance can a fall foliage forecast be trusted?
- The underlying trigger, night length, is predictable years out for any latitude, so a rough regional window is reasonable even months ahead. The weather layered on top of that trigger is not predictable that far out, which is why forecasts sharpen a great deal in the final couple of weeks before a trip.
- What is a phenology model, in plain terms?
- A phenology model tracks how much cumulative signal, mainly cooling temperature after the seasonal trigger fires, a location has built up so far. Once that running total crosses a threshold, the model marks that location as turning, the same way a bucket overflows once enough water has gone into it.
- Why does a foliage forecast give a date range instead of one exact day?
- Peak color is a canopy-wide average across many trees and species that don't all turn in unison, and it also shifts with weather that hasn't happened yet. A range captures that real uncertainty honestly, rather than implying a precision the underlying data can't support.
- Can a foliage forecast be wrong?
- Yes. A heat wave, a drought, or a hard wind and rain event can all move or shorten a season after a forecast is made, since those inputs weren't known yet when the estimate was built. That's also why a forecast improves as it's rechecked against current conditions closer to the date.
- Does elevation really change when a forecast says a spot will peak?
- Yes, substantially. Temperature drops with elevation, and colder air speeds up the same chemistry that the night-length trigger sets off. A model using fine-grained terrain data can show a mountainside turning well before the valley floor below it, even though both sit at the same latitude.
Regions in this article
More in Foliage Timing & Seasons
Foliage Timing & Seasons
False Fall: Why Some Leaves Turn in Late Summer
Red leaves in late summer usually aren't an early fall. They're almost always a stressed tree reacting to drought, damage, or disease.
2026-07-17 · 5 min read
Foliage Timing & Seasons
The Weather That Makes (or Ruins) a Great Foliage Year
Warm days, cool nights, and just enough rain make a vivid fall. Drought, wind, and an early hard freeze can flatten the same season fast.
2026-07-17 · 5 min read
Foliage Timing & Seasons
What Is Peak Foliage? How Peak Is Defined and Forecast
Peak foliage isn't the single most colorful tree or day. It's the point when the widest share of a region's canopy is in full color at once.
2026-07-17 · 5 min read